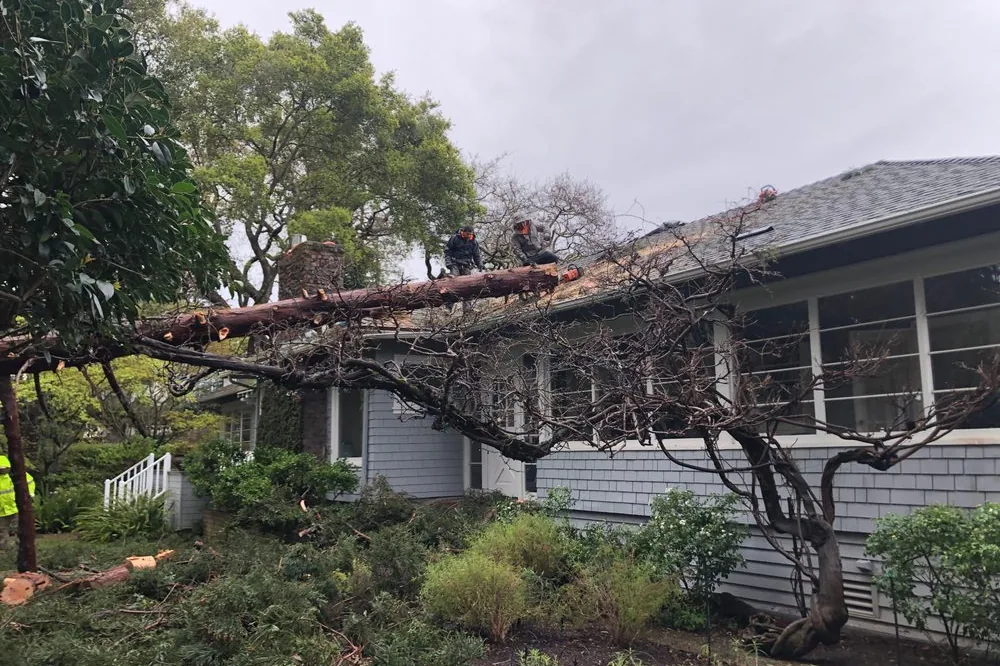
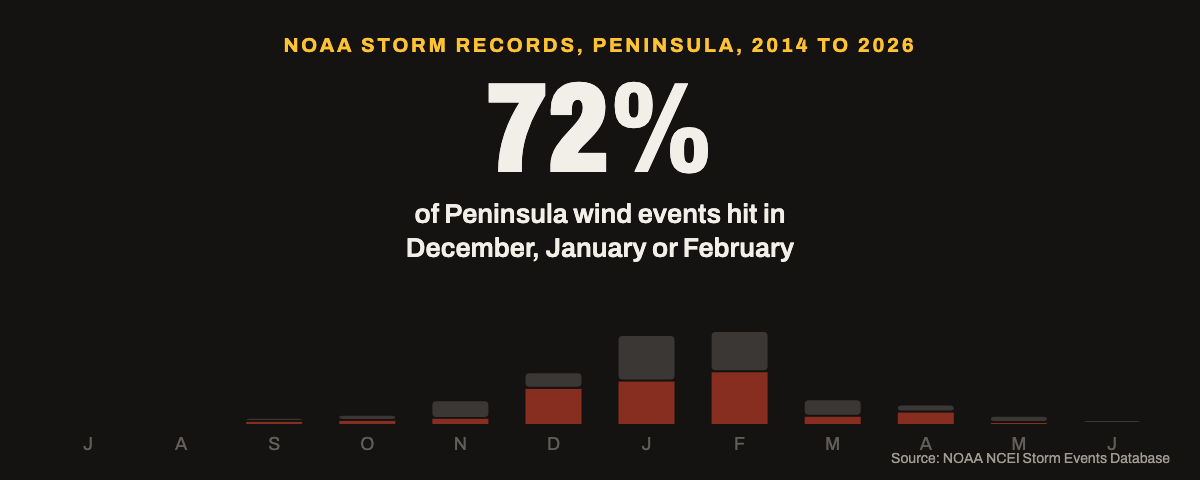
Bay Area storms bring Peninsula trees down in a tight window: December, January and February. We counted every wind event in NOAA’s storm records for San Mateo County and three Peninsula weather zones from January 2014 to June 2026. Of 310 wind events, 223 (72 percent) hit in those three months, and so did 125 of the 154 reports that describe a tree coming down (81 percent). July had none in 12 years.
This is our month-by-month look at when Peninsula trees fail, built from the NOAA Storm Events Database. We are a firefighter-owned tree crew in Redwood City, and storm nights are when our phone rings. We read every weather service report that mentions a tree.
Key findings, January 2014 to June 2026
- 72 percent of Peninsula wind events (223 of 310) hit in December, January or February.
- 81 percent of wind reports that name a tree (125 of 154) hit in those same three months.
- Zero wind events in July in 12 years. June through August had 4, and none named a tree.
- 9 of 12 storm seasons had their first tree report after November 1. The earliest was September 18, 2022.
- January 19, 2021 was the biggest day in the records: 21 wind reports, 14 of them naming a tree.
- Every death (5) and injury (4) in these wind records involved a falling tree.
Peninsula Wind Storms by Month
Peninsula wind events cluster from November through March and peak in January and February. February logged 89 wind events and January 85 from January 2014 to June 2026, against 8 for October and 0 for July. Tree reports follow the same curve.
Source: NOAA NCEI Storm Events Database, our count of 310 Strong Wind, High Wind and Thunderstorm Wind events. Months run July to June so the winter season reads as one block.
One big storm can produce many reports, so we also counted storm days. There were 99 days with at least one wind event, about eight a year, and 53 with at least one tree report, about four a year. December, January and February held 57 of the 99 storm days and 38 of the 53 tree days.
December looks smaller than January and February in raw counts, but it is the most dependable month. Across the 12 full storm seasons from July 2014 to June 2026, December had at least one wind event in 10 seasons, February in 9 and January in 7. January’s big total leans on a few huge storms, such as the offshore wind event of January 19, 2021.
| Month | Wind events | Reports naming a tree | Storm days | Days with a tree report |
|---|---|---|---|---|
| January | 85 | 41 | 19 | 12 |
| February | 89 | 50 | 21 | 15 |
| March | 23 | 7 | 9 | 3 |
| April | 18 | 11 | 5 | 4 |
| May | 7 | 1 | 5 | 1 |
| June | 3 | 0 | 3 | 0 |
| July | 0 | 0 | 0 | 0 |
| August | 1 | 0 | 1 | 0 |
| September | 5 | 2 | 2 | 1 |
| October | 8 | 3 | 6 | 3 |
| November | 22 | 5 | 11 | 3 |
| December | 49 | 34 | 17 | 11 |
| Total | 310 | 154 | 99 | 53 |
Download the monthly table (CSV)Download all 310 wind events (CSV)
Storm Seasons Since 2014
Peninsula storm seasons swing widely from year to year, so last winter is a poor guide to this one. The 2018 to 19 season logged 69 wind events and 33 tree reports, while 2023 to 24 logged 4 wind events and 2 tree reports. Six of the 12 seasons had 27 or more wind events, and four had 8 or fewer.
Each season runs July 1 to June 30. The 2 wind events from January to June 2014 belong to the 2013 to 14 season, which the file only half covers, so they are left out of this chart.
A quiet winter does not tell you much about your trees, since the next one can look like 2018 to 19. Last winter, 2025 to 26, was a middle season: 18 wind events on 12 separate days, with 3 tree reports. On Christmas morning, San Francisco International Airport recorded a 73 mph gust and a tree fell in El Granada, bringing down power lines and damaging four vehicles.
When the First Tree Report Comes Each Season
In 9 of the last 12 storm seasons, the first wind report naming a tree came after November 1. That makes October the last reliably quiet month to deal with a known problem. In three seasons a tree report came before November: September 18, 2022, October 24, 2016 and October 13, 2025.
Source: NOAA NCEI Storm Events Database, our count. Each dot is the earliest Strong Wind, High Wind or Thunderstorm Wind report in that season whose narrative names a tree.
In 2020 to 21, the first tree report did not come until January 18, 2021, and 15 of the season’s 24 tree reports came on January 18 and 19, so a late start can still mean a bad winter.
If you already know about a dead top, a hanger in the canopy or a cracked limb over the house, deal with it before November. If you have not looked at your trees in years, start with our storm prep checklist for Peninsula homes and book a professional look only for what it turns up.
Most of These Trees Fell in Moderate Wind
Most trees in these records fell in winds that did not meet the weather service’s High Wind threshold. Of the 154 wind reports that name a tree, 129 (84 percent) were logged as Strong Wind. Under National Weather Service Instruction 10-1605, that category covers winds below 40 mph sustained or 58 mph in gusts that still cause damage, injury or death.
Some of that split comes from how reports are filed. A Strong Wind entry exists only because something was damaged, while 46 of the 80 High Wind entries are just a gust reading. Still, on December 30, 2014, the weather service wrote that most areas did not reach 60 mph, yet the day produced 13 tree reports. It pointed to heavy rain earlier that month on top of “numerous dead trees across the area from years of ongoing drought.”
Whether a tree fails in the wind depends mostly on its condition: a dead top, decay in the root plate, a split trunk or soaked soil around shallow roots. Our guide to the signs a tree needs removal shows what those defects look like.
Across these records, the weather service logged 5 deaths and 4 injuries from wind events, and every one involved a falling tree. One was a man in a van on Alpine Road in Portola Valley on March 21, 2023, when a tree fell onto it.
What to Do Before This Winter
Fix defects over a target in October and November, before crew calendars fill, and spend December to February moving cars out from under the trees you are watching.
If you know about a defect over the house, the driveway or a wire, book the pruning or removal now. In Redwood City, a tree more than 38 inches around needs a permit to prune or remove, which the city says takes about 10 working days. Our removals start at $1,000 per tree and trimming starts at $300.
If a tree comes down this winter, keep people back, call 911 for anything on a power line, then call a crew. Our 24-hour emergency tree removal page covers what happens next. We charge no emergency premium, and our guide to emergency tree removal cost and insurance explains how claims usually work.
Peninsula Towns Named in the Reports
Of the 154 tree reports, 22 name a San Mateo County town or community, and 19 of those 22 fell between December and February. They include a pine through an Atherton roof on Christmas morning 2018 and San Carlos Avenue closed at Cordilleras Avenue in December 2019. Others name Belmont, Burlingame, Half Moon Bay, Menlo Park, Portola Valley and Woodside, where our tree service in Woodside covers Kings Mountain and Emerald Hills.
How We Counted
We downloaded NOAA’s Storm Events detail files for 2014 through 2026 on October 10, 2026, and kept every row filed by the San Francisco Bay Area weather office for San Mateo County or for three forecast zones: San Francisco Bay Shoreline, San Francisco Peninsula Coast and Santa Cruz Mountains. That gave 310 wind events (215 Strong Wind, 80 High Wind and 15 Thunderstorm Wind). We ran the count twice, with two separate scripts, and got the same numbers.
- Zones cross county lines. The Bay Shoreline zone includes East Bay shoreline cities and the Santa Cruz Mountains zone reaches into Santa Clara and Santa Cruz counties, so this is a Peninsula weather picture, not a strict county count.
- Tree reports. A report counts when the event’s own narrative uses the word tree or trees. We stripped web links first and read every match. NOAA’s broader episode summaries were not used.
- 2026 is partial. The data runs through June 30, 2026. Using only the 12 full seasons from July 2014 to June 2026, the December to February share is 221 of 308 wind events, still 72 percent.
- Reports are not every fallen tree. NOAA logs what observers, utilities, the CHP and the media report. Most backyard failures never make it in.
Frequently Asked Questions
When is storm season in the Bay Area?
For trees on the Peninsula, storm season runs November through March and peaks in December, January and February. In NOAA’s Storm Events Database for San Mateo County and three Peninsula weather zones, 223 of 310 wind events from January 2014 to June 2026 (72 percent) hit in December, January or February, and 268 (86 percent) hit between November and March.
Which month has the most wind storms on the Peninsula?
February and January log the most wind events, with 89 and 85 from January 2014 to June 2026. December logs fewer (49) but is the most dependable, with at least one wind event in 10 of the 12 storm seasons from July 2014 to June 2026.
How early in the fall can a storm bring trees down?
As early as September. The earliest first tree report of a season in our count was September 18, 2022, and two other seasons had one in October. In the other 9 of 12 seasons, the first wind report naming a tree came after November 1.
What wind speed can knock down a tree?
It depends more on the tree than the wind. In the Peninsula storm records, 152 of the 154 wind reports that name a tree list an estimated gust rather than a measured one. The median estimate is 40 knots, about 46 mph, and 129 of those 152 estimates are under 58 mph, the weather service’s High Wind gust threshold. A dead top, decay or soaked soil lets an ordinary winter gust finish the job.
Book a Tree Check Before December
We are a firefighter-owned crew with an ISA-certified arborist and more than 500 properties served. If your walk-around turns up a dead top, a fresh lean or a limb over the roof, call us at (650) 454-0373 or book a hazardous tree assessment and removal before the first big storm.